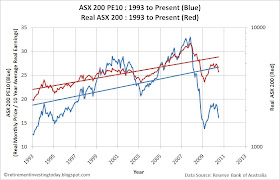
To try continue to try and squeeze some more performance out of a retirement investing strategy that is heavily focused on asset allocation I am using a cyclically adjusted PE ratio (known as the PE10 or CAPE) for the ASX 200 to attempt to value the Australian Stock Market. The method used is based on that developed by Yale Professor Robert Shiller for the S&P 500. I will call it the ASX 200 PE10 and it is the ratio of Real (ie after inflation) Monthly Prices and the 10 Year Real (ie after inflation) Average Earnings. For my Australian Equities I will use a nominal ASX 200 PE10 value of 16 to equate to when I hold 21% Australian Equities. On a linear scale I will target 30% less stocks when the ASX 200 PE10 = 26 and will own 30% more stocks when the ASX 200 PE10 = 6.
Chart 1 plots the ASX 200 PE10. Key points this month are:
ASX 200 PE10 = 16.12 which is down from 16.49 at my last update. My target Australian Equities target is now 20.9% which is up from 20.7% at my last update.
ASX 200 PE10 Average = 22.7. This would imply the market today is 29% undervalued using this measure. I am would not put to much weight on this though as my dataset is quite young dating only from 1993 and so may not have enough history built into it to be truly representative.
If I look at the S&P 500 data set since 1993 its PE10 average has been 22.5 which is very similar to the ASX 200 PE10 average, yet since 1881 has been a much reduced 16.4. If we assumed that the ASX 200 also dated back to 1881 could its average also have been around 16.4 implying that today the ASX200 with its PE10 of 16.12 is about fairly valued or even slightly undervalued.
ASX 200 PE10 20 Percentile = 17.2 down from 17.3 at my last update
ASX 200 PE10 80 Percentile = 27.6
ASX 200 PE10 Correlation with Real ASX 200 Price = 0.80
Chart 2 plots further reinforces why I am using this method. While the R^2 remains low at 0.1556 there appears to be a trend suggesting that the return in the following year is dependent on the ASX 200 PE10 value. Using the trend line with a PE10 of 16.12 results in a 1 year expected earnings projection of 16.0%. The correlation of the data in chart 2 is -0.39.
Chart 3 plots Real (after inflation) Earnings and Real Dividends. Dividends and Earnings both remain below the trend line.
As always DYOR.
Assumptions include:
- All historic figures are taken from official data from the Reserve Bank of Australia.
- June 2010 price is the 02 July 2010 market close of 4239.
- June 2010 Earnings and Dividends are assumed to be the same as the May numbers.
- Inflation data from April, May and June 2010 are estimated.


Hi RIT
ReplyDeleteIt's interesting to see how you approach the task of automating asset allocation based on PE10. Your approach is slightly different to mine as you know, but I think ultimately it's very difficult to pick one approach which is likely to produce better results going forward. Believe me, I've tried and they're all much of a muchness. I think the key point is to take valuation into account in some broadly sensible manner.
Have you done any work on bond valuations? I've just started reading and thinking about this as I use a stock/bond split, but I'm thinking about using a stock/bond/cash split with bond valuations taken into account too. So far the gist seems to be comparing yields of stocks and bonds. I guess you could look for historic averages etc. Might be worth a few hours pouring over a spread sheet.
Hi UKVI
ReplyDeleteMy approach is based purely on the fact that the correlation between the PE10 and real prices is quite high in my opinion. Of course this is all historical analysis and what is it they say, 'past performance is not an indication of future results' or something to that effect.
I haven't done any work at all on bond valuations. To date I own a very small amount of corporate bonds and about 2.4% of my net worth in index linked gilts. Most of my bond allocation is actually in NS&I Index Linked Savings Certificates as IMO for me as a higher rate tax payer their tax free status for a UK tax payer makes them an attractive investment within my bond allocation.
That said though I'd be very interested in seeing any work you do on bond allocations. Maybe you could pop a post up on your blog.